
Harvey’s
Harvey’s
Economic Impact on
Economic Impact on
Corpus Christi MSA
Corpus Christi MSA
October 11, 2017
Economic Recovery Briefing
Economic Recovery Briefing

§ Harvey’s overall damage costs (preliminary)
§ Immediate impact on the metro area
§ Property losses in affected communities
§ Analysis of recovery efforts with model simulations
§ Implications for the community and the region
§ Lesson from recent events
Overview
2
Groundwork and conceptual framework for today’s program …
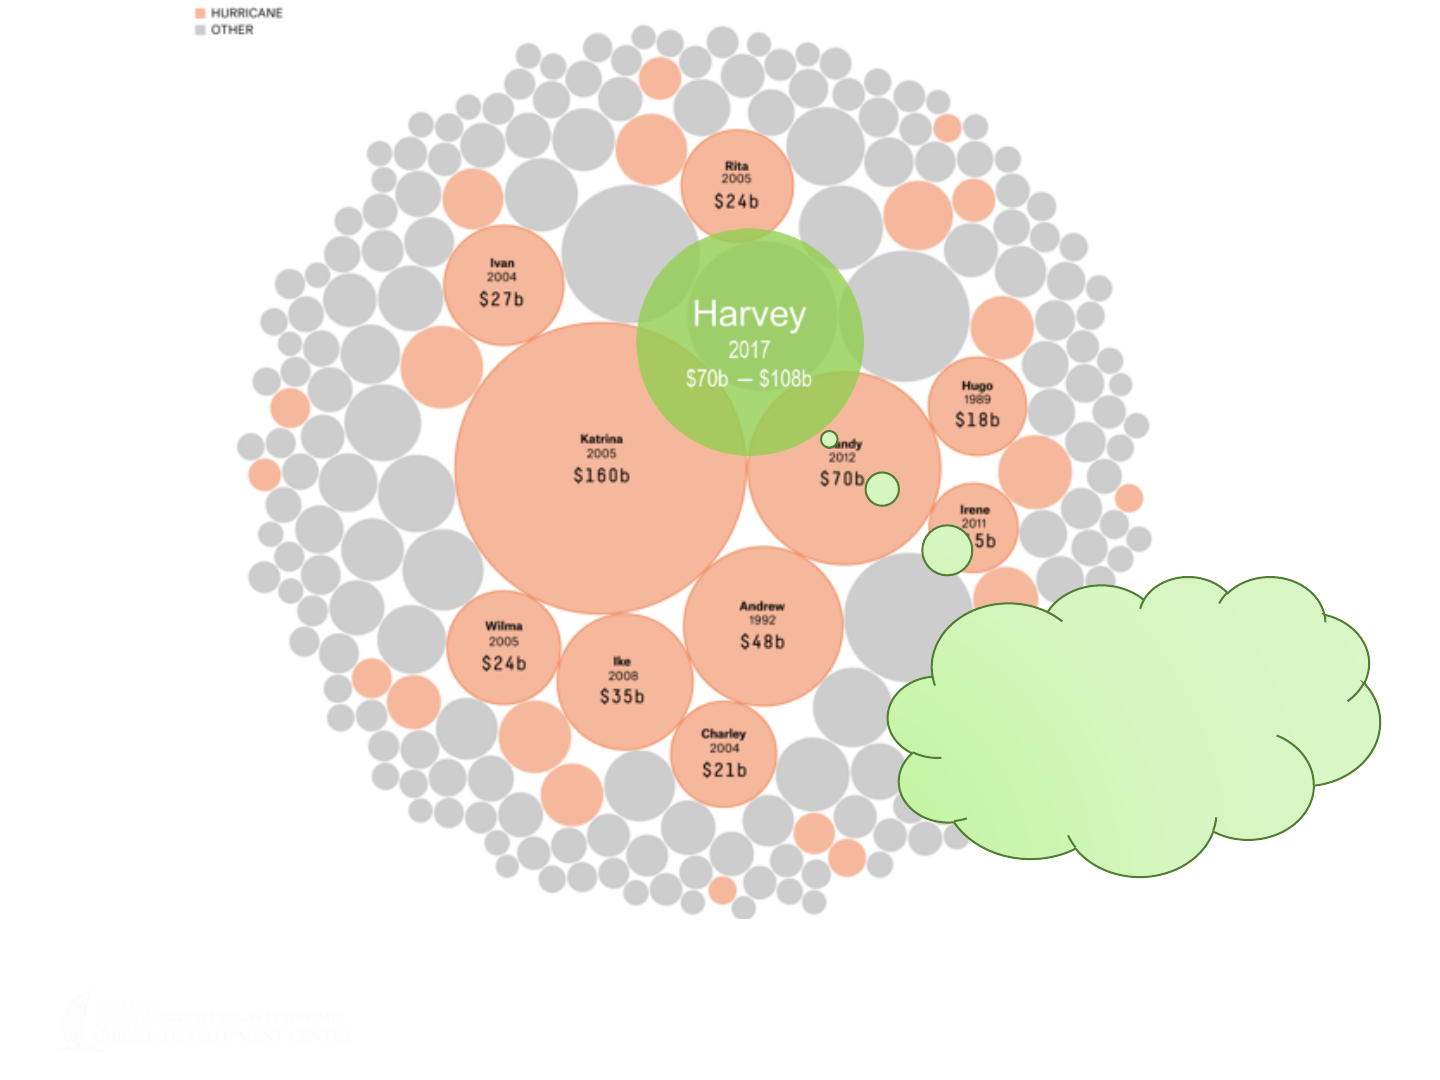
Harvey’s impact in Perspective
Latest expert estimates range from $70 billion to $108 billion
Discrepancies are
mostly due to
comparing apples
with oranges
3
Sources: NOAA, fivethirtyeight.com, and New York Times.

§ Casualties (economic losses due to deaths/injuries)
§ Property damages (insured and uninsured)
§ Infrastructure damages (industry and public facilities)
§ Temporary disruption to local business and economic
activity (evacuation, direct impacts)
§ Permanent loss of local businesses and residents
§ Increase in insurance cost (homes and businesses)
§ From the macroeconomic perspective, only lost output
(GDP, employment, earnings) counts!
Hurricane’s Costs
4
Most reported estimates cover only parts of the list …
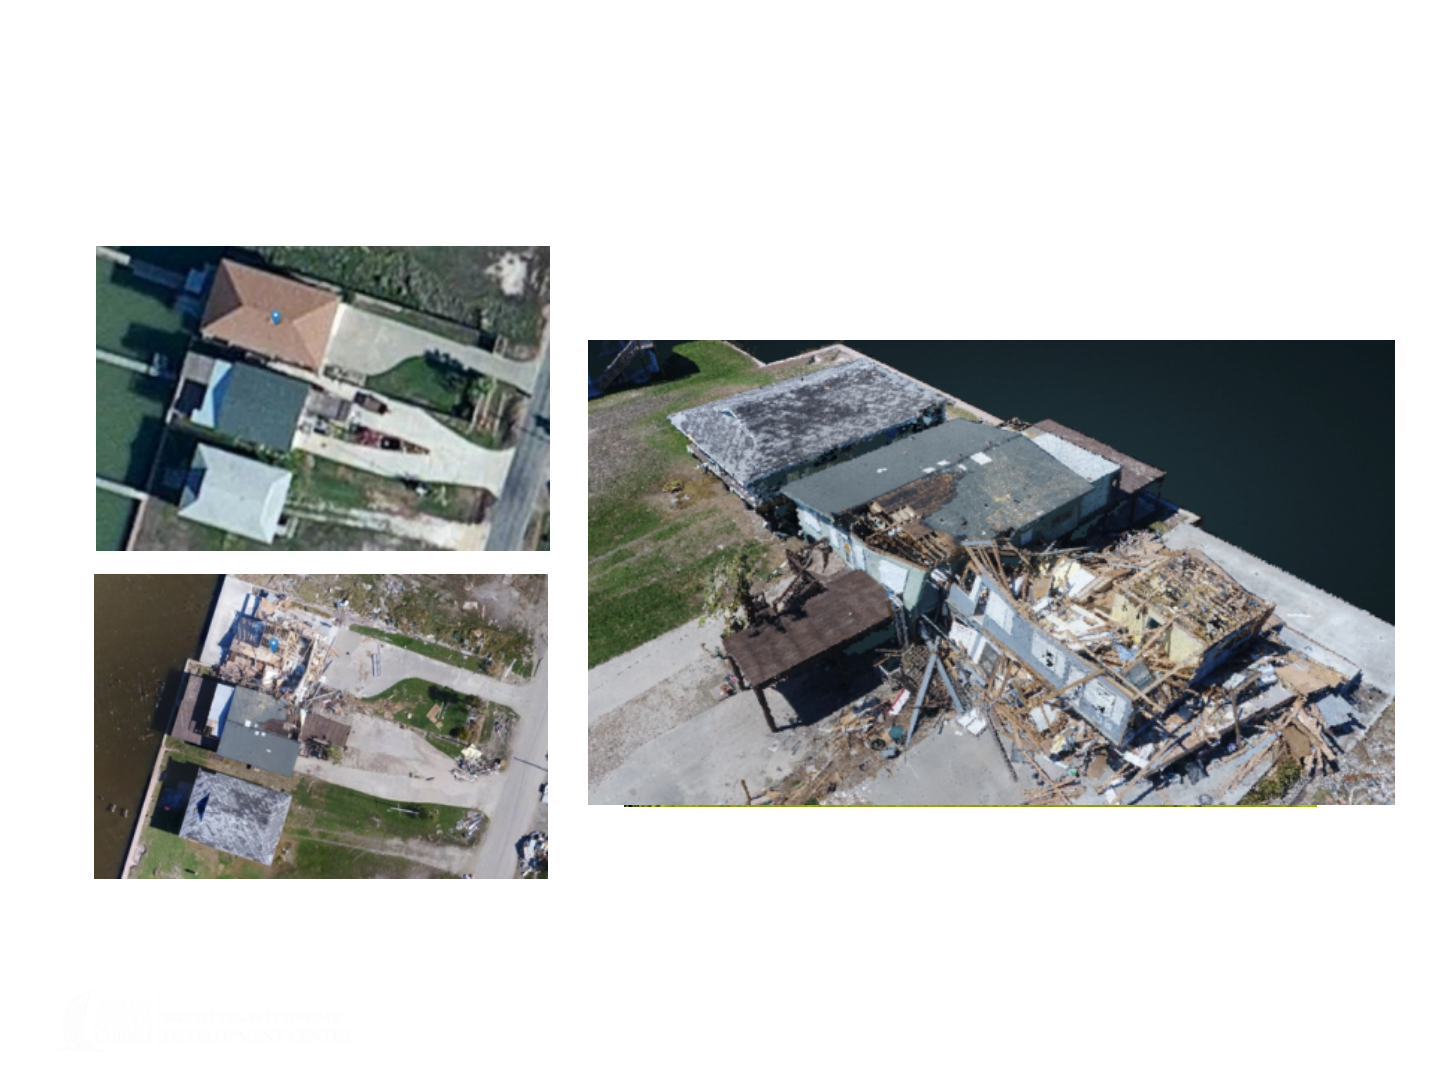
Disaster Areas
TAMUCC UAS began surveillance 2 weeks after landfall …
Location: Holiday Beach community in Rockport, Texas.
5

§ About 80% structures damaged to different degrees from
winds and storm surge
§ Equivalent of 26% structures destroyed (uninhabitable) in
Port Aransas, and 43% across Aransas County
§ Statistically significant characteristics:
ü No meaningful difference between two communities, all else equal
ü Age of structure mattered
ü Tile roofs provided 10% more protection than shingle roofs
ü Standalone structures 15% more vulnerable
ü Waterfront properties 25% more vulnerable
ü Mobile homes sustained 20% more damage
ü Majority of roof damages were associated with N/NW winds
Property Damages
Statistical findings from a random sample of 600 properties in Port Aransas and Rockport …
6

Community Profiles
Port Aransas Rockport Aransas County
Population (2016 Census) 4,054 10,645 25,721
Housing Units 4,289 6,290 15,614
- Detached Unit 2,341 3,993 10,145
- Attached Unit 1,716 1,470 1,979
- Mobile Home 232 746 3,288
- RV, boat, van 0 81 202
Annual Business Sales ($Mil) $361 $73 $885
Business Establishments 208 313 646
Property Damage from Harvey:
% Destroyed (equivalence) 26% 45% 43%
Total Home RCV ($Mil) $219 $557 $1,320
Sources: 2016 Census, EMSI, and South Texas Economic Development Center.
7
Baselines for impacted communities … reflecting vulnerability and capacity
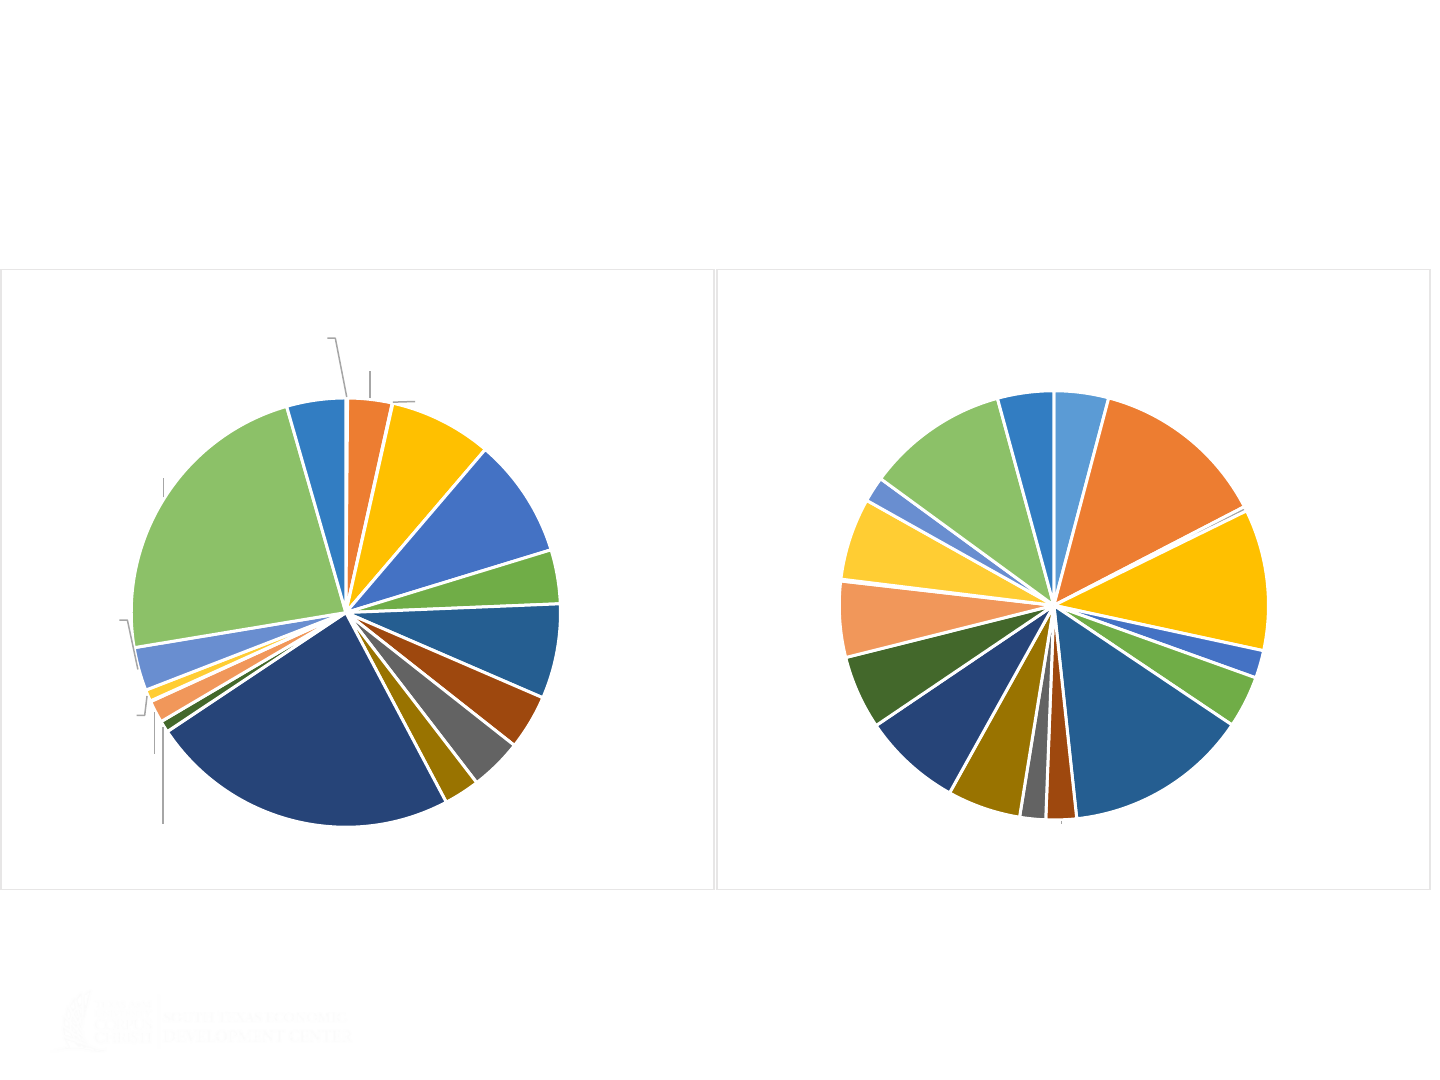
Pre-Harvey Economic Profiles by Size
Tourism and real estate together made up >50% of Port Aransas economy; retail and
hospitality were the largest sectors in Aransas County …
Source: EMSI, 2017.
Farming
$0.5
Mining, & Oil/Gas
Extraction
$12.1
Utilities
$0.2
Construction
$27.9
Manufacturing
$32.6
Wholesale Trade
$14.7
Retail Trade
$25.8
Transportation &
Warehousing
$14.9
Information
$14.2
Finance & Insurance
$9.7
Real Estate
$84.5
Professional &
Technical Services
$3.2
Administrative &
Waste Management
$6.0
Educational Services
$0.2
Health Care & Social
Assistance
$3.2
Arts & Recreation
$11.8
Accommodation &
Food Services
$83.7
Other Services
$16.1
Port Aransas Economy ($Mil Sales)
Farming
$36.4
Mining, & Oil/Gas
Extraction
$117.5
Utilities
$3.1
Construction
$94.3
Manufacturing
$18.5
Wholesale Trade
$34.8
Retail Trade
$123.0
Transportation &
Warehousing
$20.4
Information
$17.3
Finance & Insurance
$48.9
Real Estate
$66.1
Professional &
Technical Services
$49.2
Administrative &
Waste Management
$50.7
Educational Services
$1.2
Health Care & Social
Assistance
$54.7
Arts & Recreation
$16.9
Accommodation &
Food Services
$94.9
Other Services
$37.5
Aransas County Economy ($Mil Sales)
8
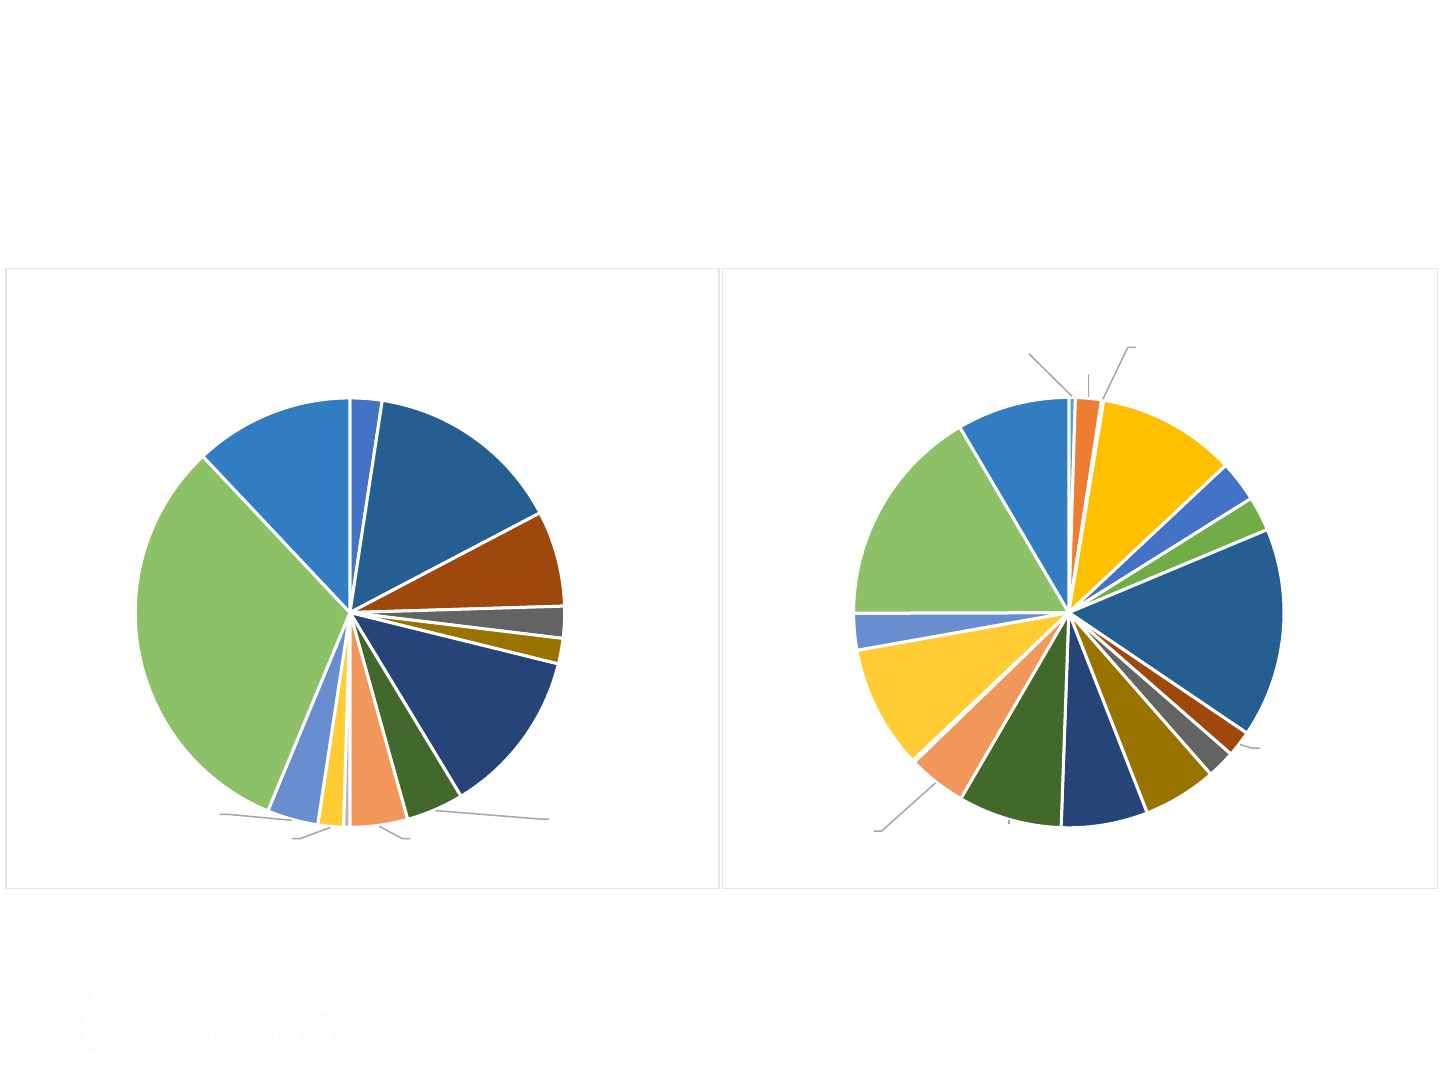
Pre-Harvey Economic Profiles by Number
Tourism and real estate together made up 55% of Port Aransas businesses; retail and
hospitality made up 31% of Aransas County businesses …
Source: EMSI, 2017.
Manufacturing
5
Retail Trade
31
Transportation &
Warehousing
15
Information
5
Finance & Insurance
4
Real Estate
26
Professional &
Technical Services
9
Administrative &
Waste Management
9
Educational Services
1
Health Care & Social
Assistance
4
Arts & Recreation
8
Accommodation &
Food Services
66
Other Services
25
Port Aransas Business Establishments
Farming
3
Mining, & Oil/Gas
Extraction
12
Utilities
1
Construction
64
Manufacturing
19
Wholesale Trade
16
Retail Trade
97
Transportation &
Warehousing
12
Information
13
Finance & Insurance
34
Real Estate
40
Professional &
Technical Services
48
Administrative &
Waste Management
27
Educational Services
1
Health Care & Social
Assistance
57
Arts & Recreation
17
Accommodation &
Food Services
102
Other Services
52
Aransas County Business Establishments
9

§ One week of business shut down in metro area
• $1.2B in gross sales activity, including wage earnings, etc.
§ Loss in capital stock
• Property damages in other areas are considered relatively modest
and scattered
• No direct impact on land
Harvey’s Immediate Impacts
Known knowns of immediate direct economic damage …
Port Aransas Aransas County
Residential $219M $1.3B
Nonresidential $12M $240M
10

§ Short- and long-term impacts on local
businesses and residents, including Winter
Texans
§ Increases in insurance costs for local businesses
and households
§ Recovery paths of impacted communities
Harvey’s Extended Impacts
Unknown knowns whose values to be realized … beyond direct damage
11

§ 3 Phases:
• Direct Impact (immediate): Loss of economic activity and capital
• Recovery (transitory): Rebuilding efforts take effect
• New Normal (equilibrium): Long-run occurs years later
§ Model Assumptions:
• All industries shut down when the area was hit
• Immediate loss of residential and nonresidential capital stock (values
correspond to observed damages)
• Separate capacity (resources) constraints for local and regional
economies
• Three alternative speeds in restoring businesses and residential and
nonresidential capital losses (100%; 25%; 10% per year)
§ Self-adjustment back to baseline occurs even without
government intervention, but “in the long run, we are all dead!”
Recovery Scenarios
Simulations of direct impact and response over time with a regional economic model
12
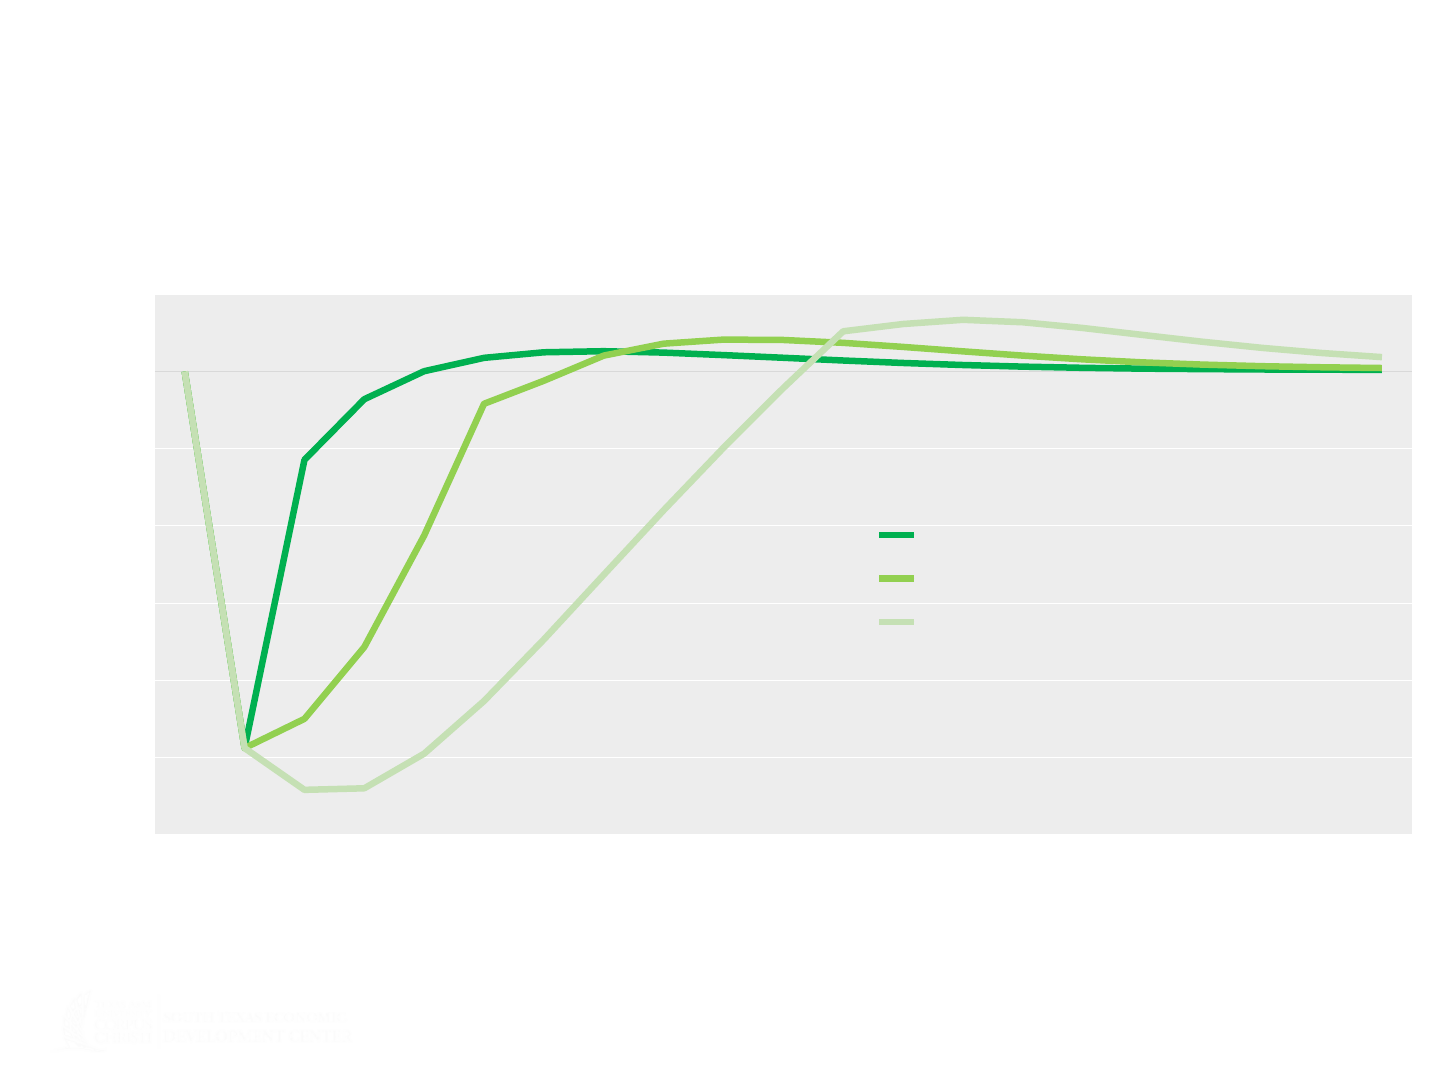
Road to Recovery
Slower rebuild efforts are more costly … cumulative output loss doubles with each delay
13
Source: South Texas Economic Development Center.
2016 2017 2018 2019 2020 2021 2022 2023 2024 2025 2026 2027 2028 2029 2030 2031 2032 2033 2034 2035 2036
0
200
-200
-400
-600
-800
-1,000
-1,200
Port Aransas Output ($Mil Sales)
Immediate Recovery (1 year)
Rapid Recovery (4 years)
Slow Recovery (10 years)
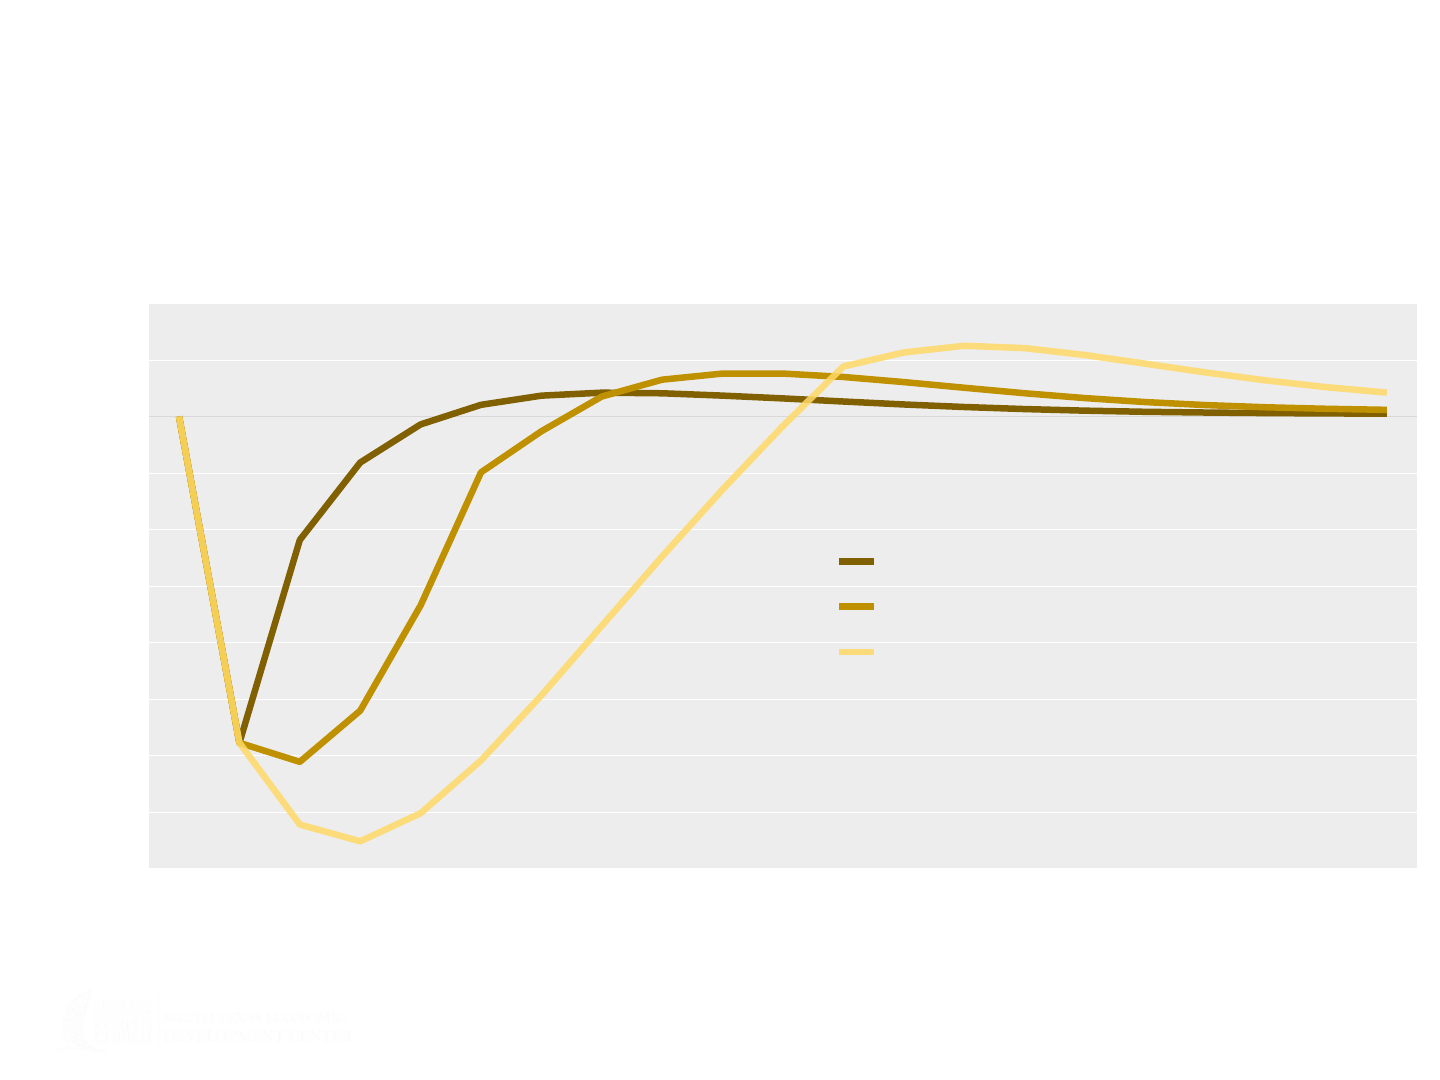
Road to Recovery
More rapid recovery is less painful … but challenged by available capacity
14
Source: South Texas Economic Development Center.
2016 2017 2018 2019 2020 2021 2022 2023 2024 2025 2026 2027 2028 2029 2030 2031 2032 2033 2034 2035 2036
0
1,000
2,000
-1,000
-2,000
-3,000
-4,000
-5,000
-6,000
-7,000
-8,000
Aransas County Output ($Mil Sales)
Immediate Recovery (1 year)
Rapid Recovery (4 years)
Slow Recovery (10 years)
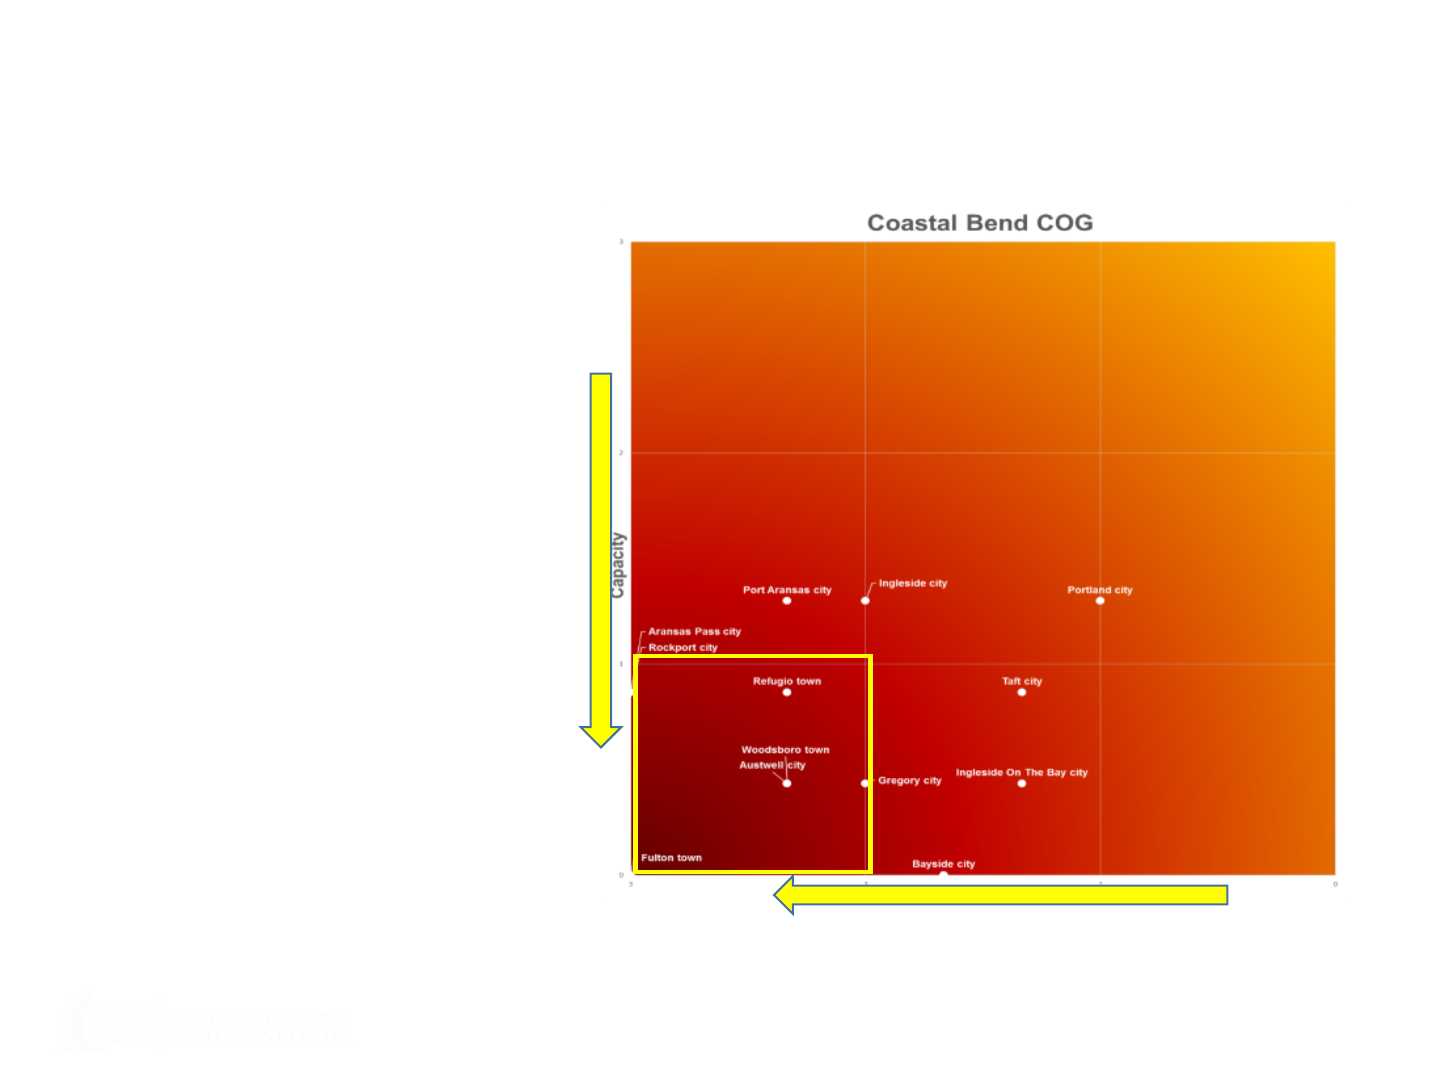
Communities with highest
impacts and lowest
estimated capacity:
• Aransas Pass
• Austwell
• Fulton
• Gregory
• Refugio
• Rockport
• Woodsboro
15
HIGHESTIMPACT
HIGHIMPACT
LOW
CAPACITY
HIGHCAPACITY
High Storm Impact, Low Capacity
Implication: More spillover economic impact on other parts of the Coastal Bend …
Source: Community Planning and Capacity Building RSF by Richard Martin, FEMA, October 5, 2017.
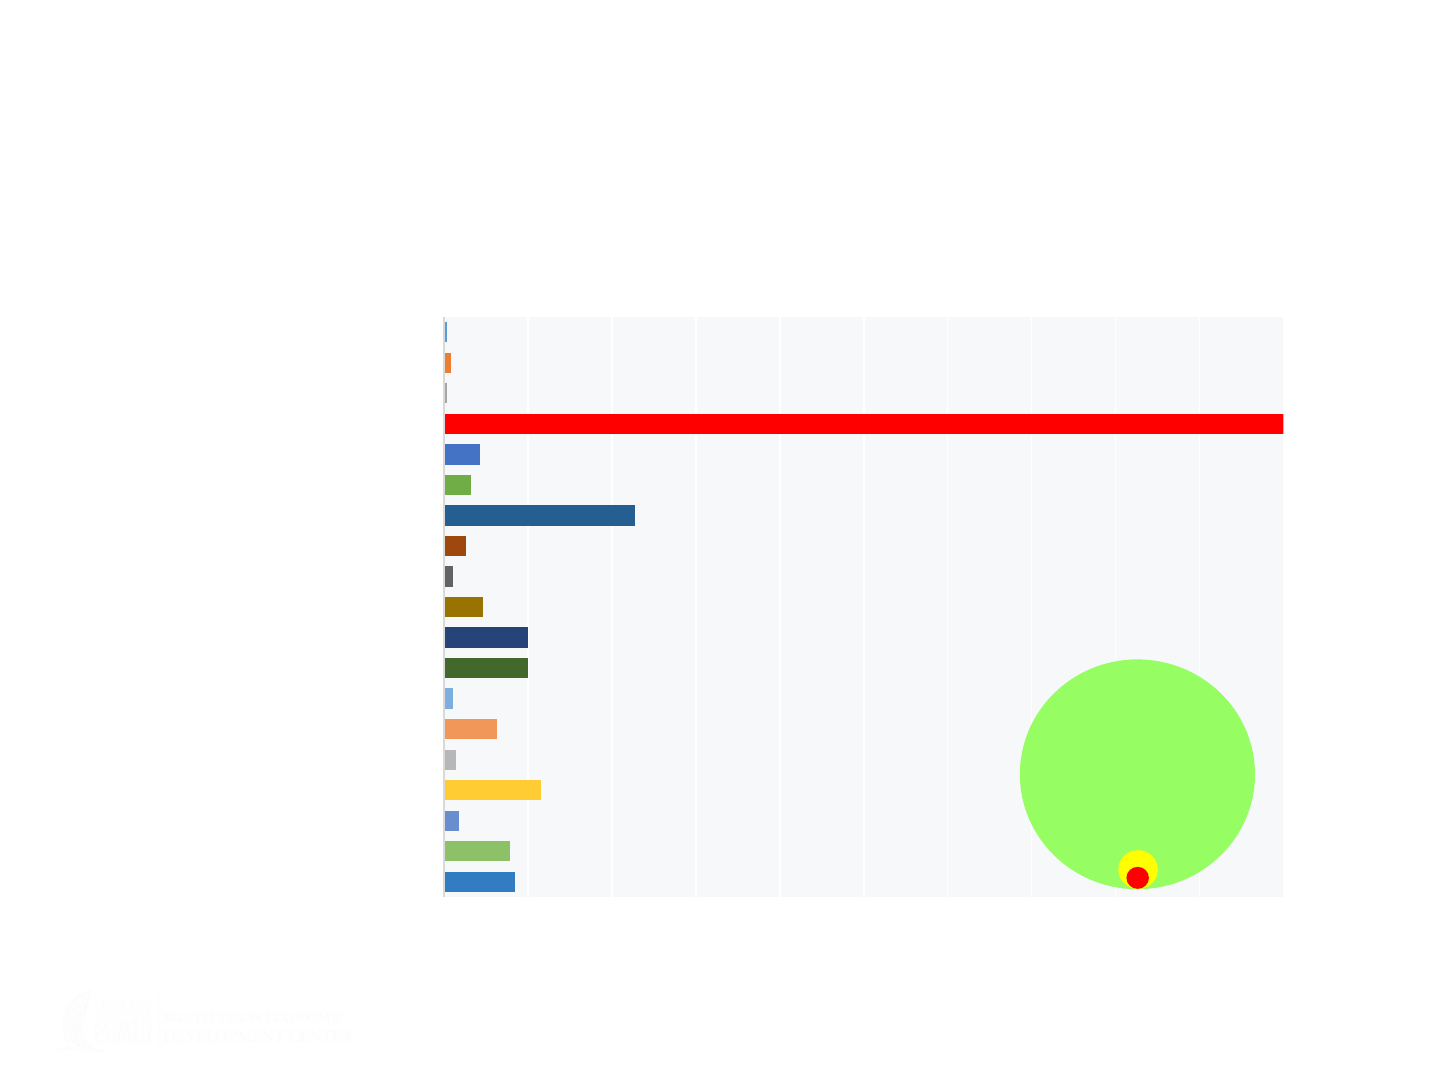
Indirect Impact on Region
Rebuild efforts boost regional construction and other industries …
Source: South Texas Economic Development Center.
10,0009,0008,0007,0006,0005,0004,0003,0002,0001,0000
Farming
Mining & Oil/Gas Extraction
Utilities
Construction
Manufacturing
Wholesale Trade
Retail Trade
Transportation & Warehousing
Information
Finance & Insurance
Real Estate
Professional & Technical Services
Management
Administrative & Waste Management
Educational Services
Health Care & Social Assistance
Arts & Recreation
Accommodation & Food Services
Other Services
Full Recovery’s Impact on Regional Employment (Job Years)
16,000
16
Corpus Christi MSA
Aransas County
Port Aransas

§ High economic impact from kick-starting businesses and restoring
capital infrastructure and properties sooner
§ But capacity matters: Reconstruction activity requires financial capital,
labor input and other resources
§ So it is not a community problem, but a regional solution
§ Possible to move above pre-disaster levels, especially with
federal/state support (rebuild vs. restoration)
§ Speedy recovery is vital for minimizing long-term economic losses
─ Resilience is the ability to “rebound economically from a disaster and to take
advantage of post-disaster market opportunity”… Jeffrey Sjostrom, 2012
§ No magic number: Reimagining the future of Coastal Bend
─ Tourism for coastal communities
─ New (more expensive) homes for displaced residents
─ Possible population loss in rural communities, particularly in Refugio
Takeaways
17
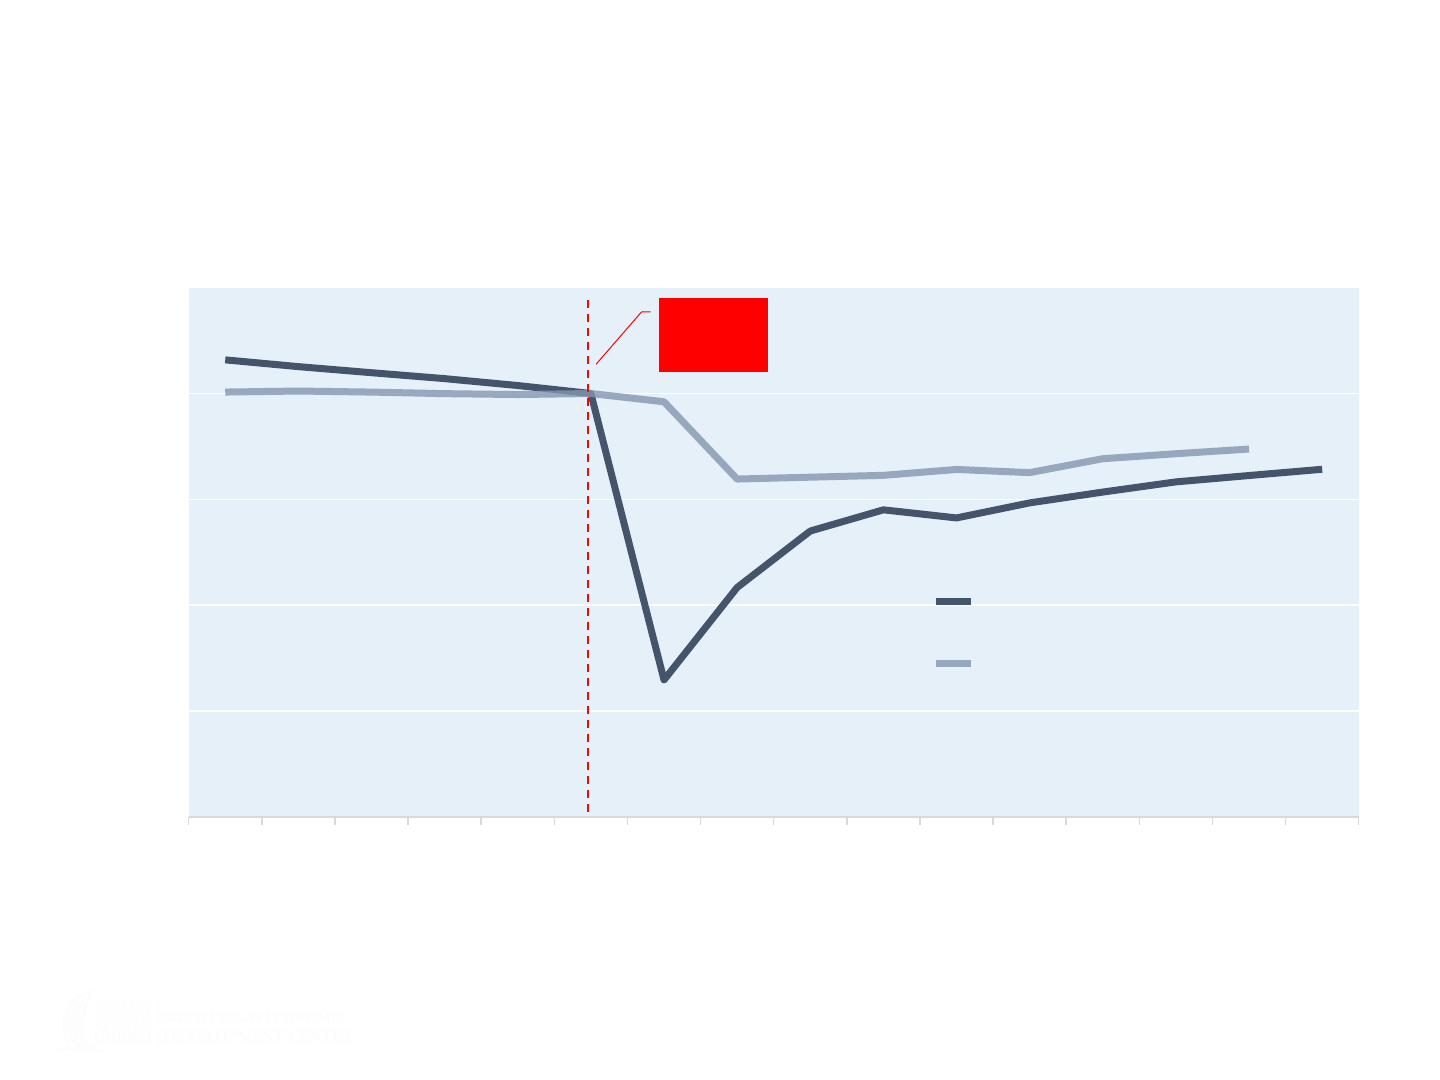
A Tale of Two Cities
What to learn from two recent storms and distinctive responses?
18
Year struck by Hurricane
-5 -4 -3 -2 -1 0 +1 +2 +3 +4 +5 +6 +7 +8 +9 +10
20
40
60
80
100
120
Population Trends (Base Year = 100)
New Orleans (Katrina 2005)
Galveston (Ike 2008)
Source: U.S. Census Bureau.
On
Impact
Jim Lee
(361) 825-5831
jlee@tamucc.edu
SouthTexasEconomy.com
Thank you!